Porting Go's ntcharts to TypeScript: Terminal Charts That Match Go to the Last Bit
Bubble Tea has components for text, lists and tables, but no charts. In Go, the gap is filled by ntcharts from NimbleMarkets: a canvas of styled cells, drawing helpers for lines, braille dots, columns and candlesticks, and a set of charts built on them. It is the library you reach for when a Bubble Tea program needs a graph.
Now it's available in TypeScript, and its output matches the Go library's, byte for byte.
I – What Shipped
@oakoliver/ntcharts 1.0.0, a port of ntcharts v2.9.0, the release on the branch that targets Bubble Tea v2.
npm install @oakoliver/ntcharts @oakoliver/lipgloss @oakoliver/bubbles @oakoliver/bubbletea
It ports 12 Go packages: the canvas and its runes, buffers and drawing helpers; the bar chart, sparkline and heatmap; the line chart and its streaming, time series and wave variants; and spec, which builds any of them from a JSON description. Each Go package is a subpath export, @oakoliver/ntcharts/barchart and so on.
The numbers:
- 11,549 lines of Go in the ported packages became 13,350 lines of TypeScript.
bun testruns 853 tests. 505 come from upstream's 294 Go tests and examples (a table test becomes one test per case), 342 render a scenario with both the Go library and the port and compare the output, and the rest check the README's samples and mouse handling.- No runtime dependencies besides the peer dependencies: Lip Gloss, Bubbles and Bubble Tea, and optionally
@oakoliver/bubblezonefor the mouse.
Not ported: the picture packages (images through the Kitty graphics protocol or half-block characters), which depend on Go's image decoders and on POSIX shared memory, and spec/echarts, which exports to a Go web-charting library. Section VIII has the details.
II – What ntcharts Is
The library is built in three layers.
The canvas. A grid of cells, each holding one character and a Lip Gloss style. It has a viewport (a window onto a larger grid that you can move with the keys, the mouse wheel or a drag) and a View() that renders every cell to a string. Every chart owns a canvas.
The graph helpers. Functions that draw onto a canvas and know how characters combine. Draw a line through a cell that already holds an axis, and └ plus ─ becomes ┴. Draw two braille characters on the same cell and their dots merge: ⠁ plus ⠈ is ⠉. A column with a height of 3.4 is three full blocks and a ▃ on top, an eighth-of-a-cell resolution from the Unicode block elements. A candlestick is built from thin and heavy half-lines (╷ ╹ ┃ ╿) so that a body can end in the middle of a cell.
The charts. A line chart is a canvas with two axes, a scale for each (linear or logarithmic), tick labels and an optional second Y axis. The streaming, time series and wave charts add their own way of turning data into points. The bar chart, sparkline and heatmap sit directly on the canvas helpers. The time series chart also draws candlesticks from four data sets.
Most of the code is arithmetic: map a value to a cell, round it, pick a character. That is what made the testing in section IV possible, and what made section V necessary.
III – Translating the API
Names. The Go API has package functions (barchart.New, WithHorizontalBars, graph.DrawColumns) and methods (m.View(), m.PushAll()). The port keeps the package functions' Go names, as @oakoliver/bubbletea does with NewProgram and Batch, and writes methods and fields in camel case. Code reads almost the same in both languages; section IV has a Go scenario next to its TypeScript twin.
Runes are strings. A Go rune is a code point, and the drawing code does arithmetic on them: a braille pattern is 0x2800 plus a bit per dot, and merging two patterns is a bitwise OR. In the port a rune is a one-character string, which is what a user wants to pass ('█'), and the few places that need arithmetic convert with codePointAt. Points are plain { x, y } objects, so data can be pushed as literals.
Models change in place. Go models are values: m, cmd = m.Update(msg) returns a modified copy, although the canvas cells behind it are shared. In the port, update(msg) changes the chart and returns it, so a chart's grid of cells is never copied per message. The one place where upstream relies on a copy, a test that copies a chart and changes the copy's second axis, uses an explicit clone().
Messages by tag. The charts react to key presses, the mouse wheel, clicks and drags. They recognise those messages by their _tag field, not with instanceof, so a chart works with whichever copy of Bubble Tea the application loaded. Bubble Tea is only a type import; at runtime the charts never load it.
The mouse without a dependency. Upstream imports bubblezone, the library that maps a mouse click to the component under it. The port describes the three methods it calls (newPrefix, mark, get) as a TypeScript interface and takes any object that has them. @oakoliver/bubblezone satisfies it, so mouse support works, but a program that only prints charts never installs it.
Subpath exports and one copy of each class. Each chart is its own entry point. The ESM build uses esbuild's code splitting, so /canvas and /barchart share one canvas module instead of each bundling its own.
IV – Testing Against Go Itself
Porting upstream's tests is the first check: all 43 test files of the ported packages, with their golden files, now run under bun test. But upstream's tests check what upstream thought to check. Most chart output is never compared with anything.
So the port has a second suite that asks the Go library directly. tests/parity/go is a small Go program that imports upstream ntcharts v2.9.0. Each scenario builds a chart, feeds it data, sends it key or mouse messages, and returns View(). This one checks how bar labels with accented and CJK characters are cut (bcBar, bcV and bcDraw are small helpers in the same file):
register("barchart/vertical-unicode-label", func() string {
	// labels are cut by bytes upstream: a multi-byte rune can be split
	m := barchart.New(14, 8, barchart.WithStyles(bcAxis, bcLabel))
	m.PushAll([]barchart.BarData{
		bcBar("héllo", bcV("v", 3, bcRed)),
		bcBar("日本語", bcV("v", 6, bcGreen)),
		bcBar("ñ", bcV("v", 4.5, bcCyan)),
	})
	return bcDraw(m)
})
The program writes every result to goldens.json. A TypeScript file registers the same scenario name with the port's code:
register('barchart/vertical-unicode-label', () => {
  // labels are cut by bytes upstream: a multi-byte rune can be split
  const m = barchart.New(14, 8, barchart.WithStyles(bcAxis, bcLabel));
  m.pushAll([
    bcBar('héllo', bcV('v', 3, bcRed)),
    bcBar('日本語', bcV('v', 6, bcGreen)),
    bcBar('ñ', bcV('v', 4.5, bcCyan)),
  ]);
  return bcDraw(m);
});
The test renders it and compares the two strings. There are 342 scenarios: 110 for the canvas, graph helpers and runes, 78 for the bar chart, sparkline and heatmap, 85 for the line charts, 61 for spec and 8 for the README's snippets. Half of the line chart scenarios have colors, so styles are compared too, not only characters.
One difference is not a bug and is normalised before comparing. Go's Lip Gloss packs a style into one escape sequence, ESC[1;7;38;2;255;0;0;44m; the TypeScript Lip Gloss writes one per attribute, ESC[1mESC[7mESC[38;2;255;0;0mESC[44m. The terminal shows the same thing, so the test merges adjacent sequences on both sides. Nothing else is normalised.
Every scenario passes. Getting there found the problems in the next two sections.
V – The Last Bit
Line charts print tick labels: a few values spread over each axis, computed from the range, the scale and the chart size. Translated literally, the TypeScript computes some of those values one bit away from Go:
-                1.7│
+ 1.7000000000000002│
The first line is Go, the second the port, with a label formatter that prints the full value (Go's fmt.Sprint). The computation is the same multiply and add in both languages. The difference comes from the Go compiler: on arm64 it compiles a*b + c to a single fused multiply-add instruction, which rounds once. JavaScript computes a*b, rounds it, adds c, and rounds again.
go tool objdump on the parity program lists every FMADD in the ntcharts code, and each of those expressions whose result can differ now calls an exact fma(a, b, c) written in TypeScript. With random products of numbers below 100, plain a*b + c differs from the fused result in 0.25% of cases; the fma gives Go's result on all of 200,000 inputs checked against Go's math.FMA.
The second source was the math library. Go does not call the C library for math.Log, Log10, Exp or Pow; it has its own implementations. JavaScript engines use theirs, and they disagree in the last bit more often than I expected. On a million random inputs (positive numbers from about 1e-9 to 5e8, exponents from -30 to 30, powers from -4 to 4):
| Function | Differs from Go, Bun 1.4.4 | Differs from Go, Node 26.8.1 |
|---|---|---|
Math.log |
0.42% | 0.13% |
Math.log10 |
17.6% | 16.1% |
Math.exp |
10.1% | 2.1% |
Math.pow |
39.3% | 39.3% |
Bun and Node also disagree with each other, so even a test that passed on one runtime could fail on the other. The port has Go's algorithms in src/internal/gomath.ts, and they return the same bits as Go on all 200,000 checked inputs. Log-scale axes use them; with Math.*, a log-scale scenario that pans and zooms prints 501187.2336272725 where Go prints 501187.2336272724.
How much does this matter on screen? With the default label formatter, which rounds to whole numbers, very little. Replacing fma with plain arithmetic breaks one scenario of 342, and replacing Go's math functions with Math.* breaks one other; both are scenarios written to print values in full, to pin these cases down. But a last-bit difference can move a value across a rounding boundary, and then a label or a point lands one cell away from where Go puts it. The point of a byte-for-byte comparison is that you don't have to argue about which differences are visible.
One limit is worth stating: the goldens are generated on an Apple Mac, which is arm64. On amd64, Go does not fuse by default, so a few values could differ there from what the port prints.
VI – Smaller Go-isms
A few more things only showed up because the comparison is exact.
Ties round to even. Labels use fmt.Sprintf("%.0f", v). Go rounds an exact half to the even neighbour, so 2.5 prints as 2; JavaScript's toFixed rounds it away from zero, to 3. The port has a sprintfF that rounds exact ties to even and otherwise trusts toFixed, which, like Go, rounds the exact binary value.
Strings are bytes. The bar chart truncates a label to the bar width with l[:m.barWidth]. In Go that slices bytes, so "Δx" cut to one column becomes half of Δ, which prints as �. The heatmap measures labels with len(), also bytes. The port reproduces both with a small helper that counts and cuts UTF-8 bytes, including Go's one replacement character per broken byte.
Lip Gloss v2 styles are values. This line in the column drawing code looks like it combines two colors where two bars overlap:
rs.Background(s.GetForeground()).Foreground(c.Style.GetForeground())
In Lip Gloss v2, Background returns a new style and leaves rs alone, and the result is discarded. The line does nothing, and the cell is drawn with the plain style. The TypeScript Lip Gloss also returns new styles, so a literal translation would behave the same; the port drops the line and says why in a comment, so that nobody "fixes" it into a visible difference.
A conversion that depends on the CPU. int(f) of a NaN or an infinity is not defined in Go and differs between amd64 and arm64. The port follows arm64 (NaN becomes 0, infinities saturate), matching the machine that generates the goldens.
Some behaviours look like bugs but are upstream's, and the port keeps them. A horizontal bar chart measures its labels when bars are switched to horizontal, not when data is pushed, so WithDataSet(...) must come before WithHorizontalBars(). A new time series chart starts its time range at the current time, which stretches a chart of last month's data to today. And two outputs in upstream's README, the streamline and wave line examples, come from older versions: the v2.9.0 code prints them slightly differently. The port's README shows what the code prints, and a test checks it.
VII – Two Dashboards
The examples include one small program per chart type, each a port of an upstream example, and two full-screen programs that use several charts together.
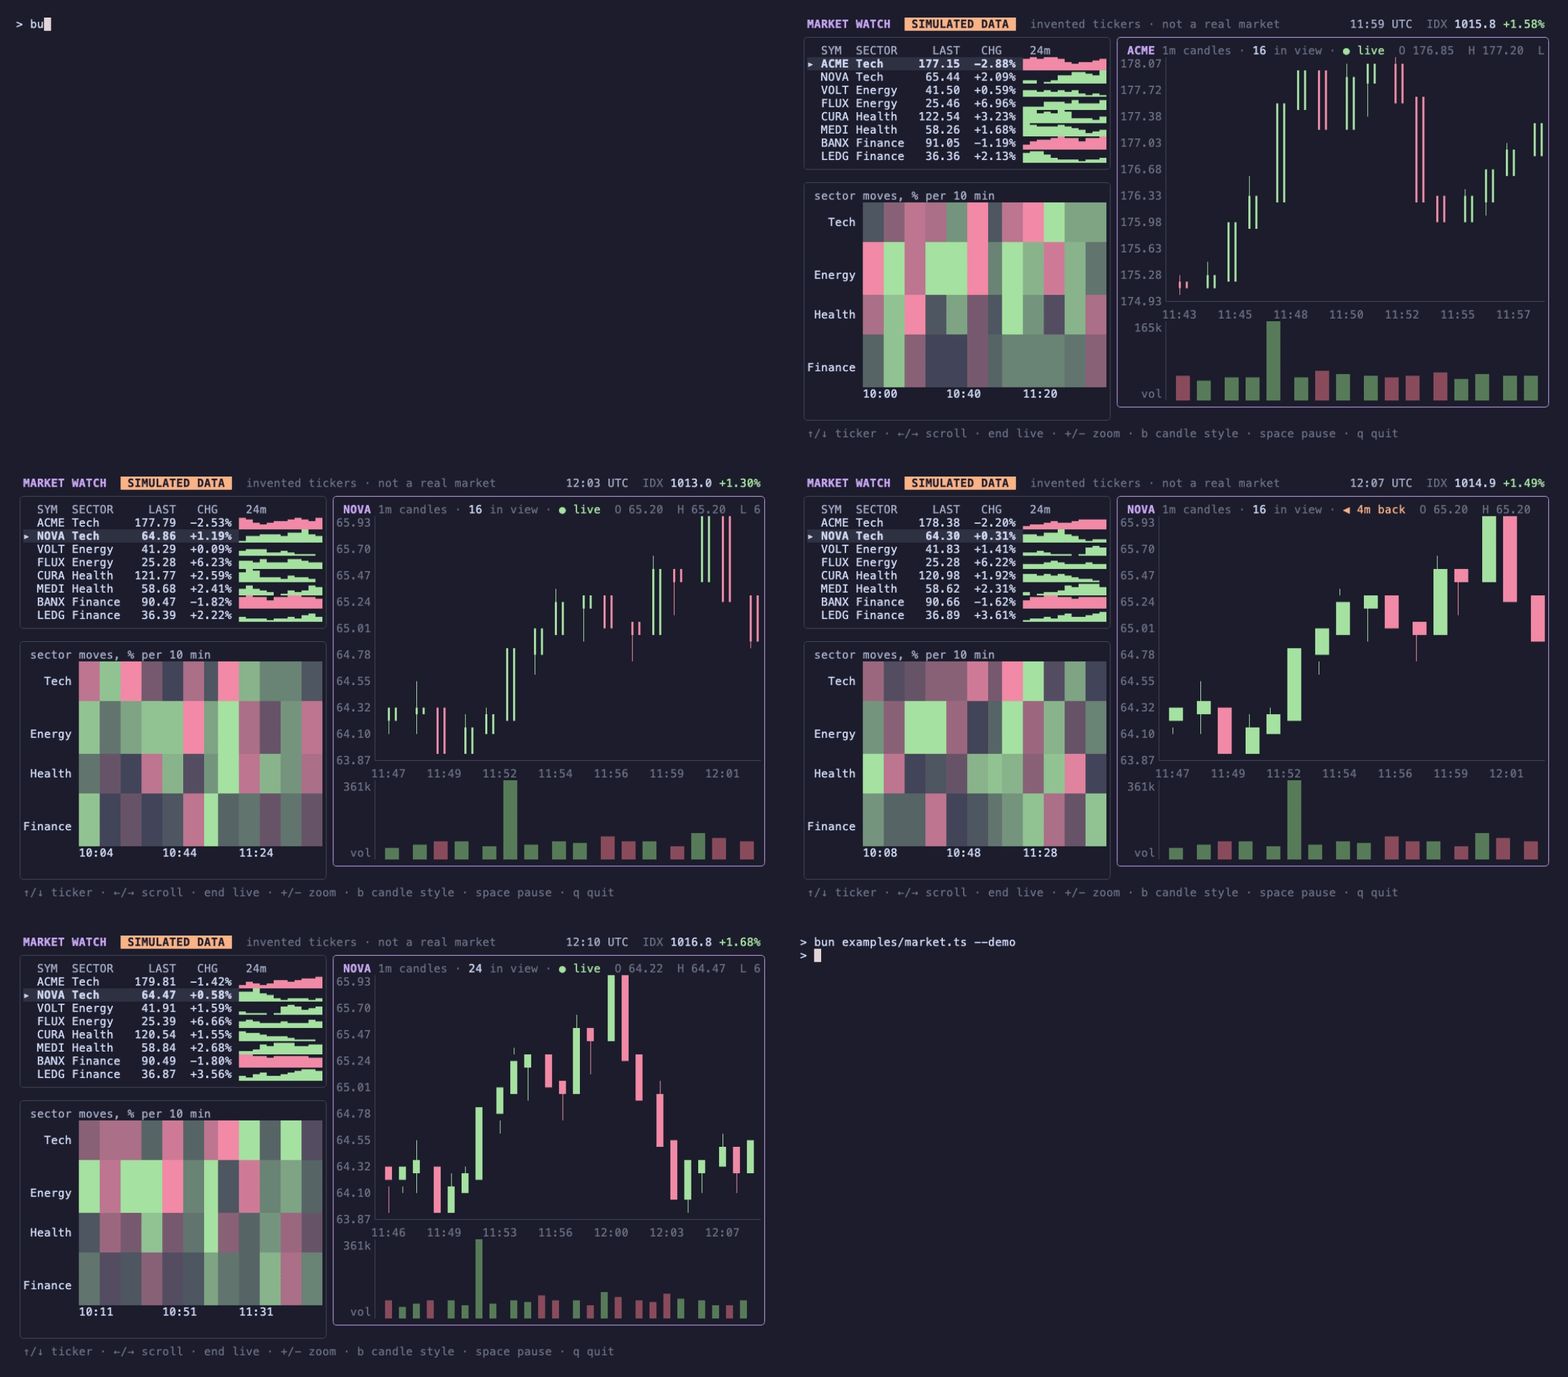
market.ts, shown at the top, is a trading dashboard on invented data: eight made-up tickers whose prices follow a random walk with market, sector and news components. The candles are a time series chart; the volume panel below is a plain canvas whose columns sit exactly under their candles, because both use the chart's candleColumn(); the sector heatmap shows 10-minute moves. The header says that the data is simulated.
netmon.ts measures real latency: once a second it times a TCP connection to five public hosts.
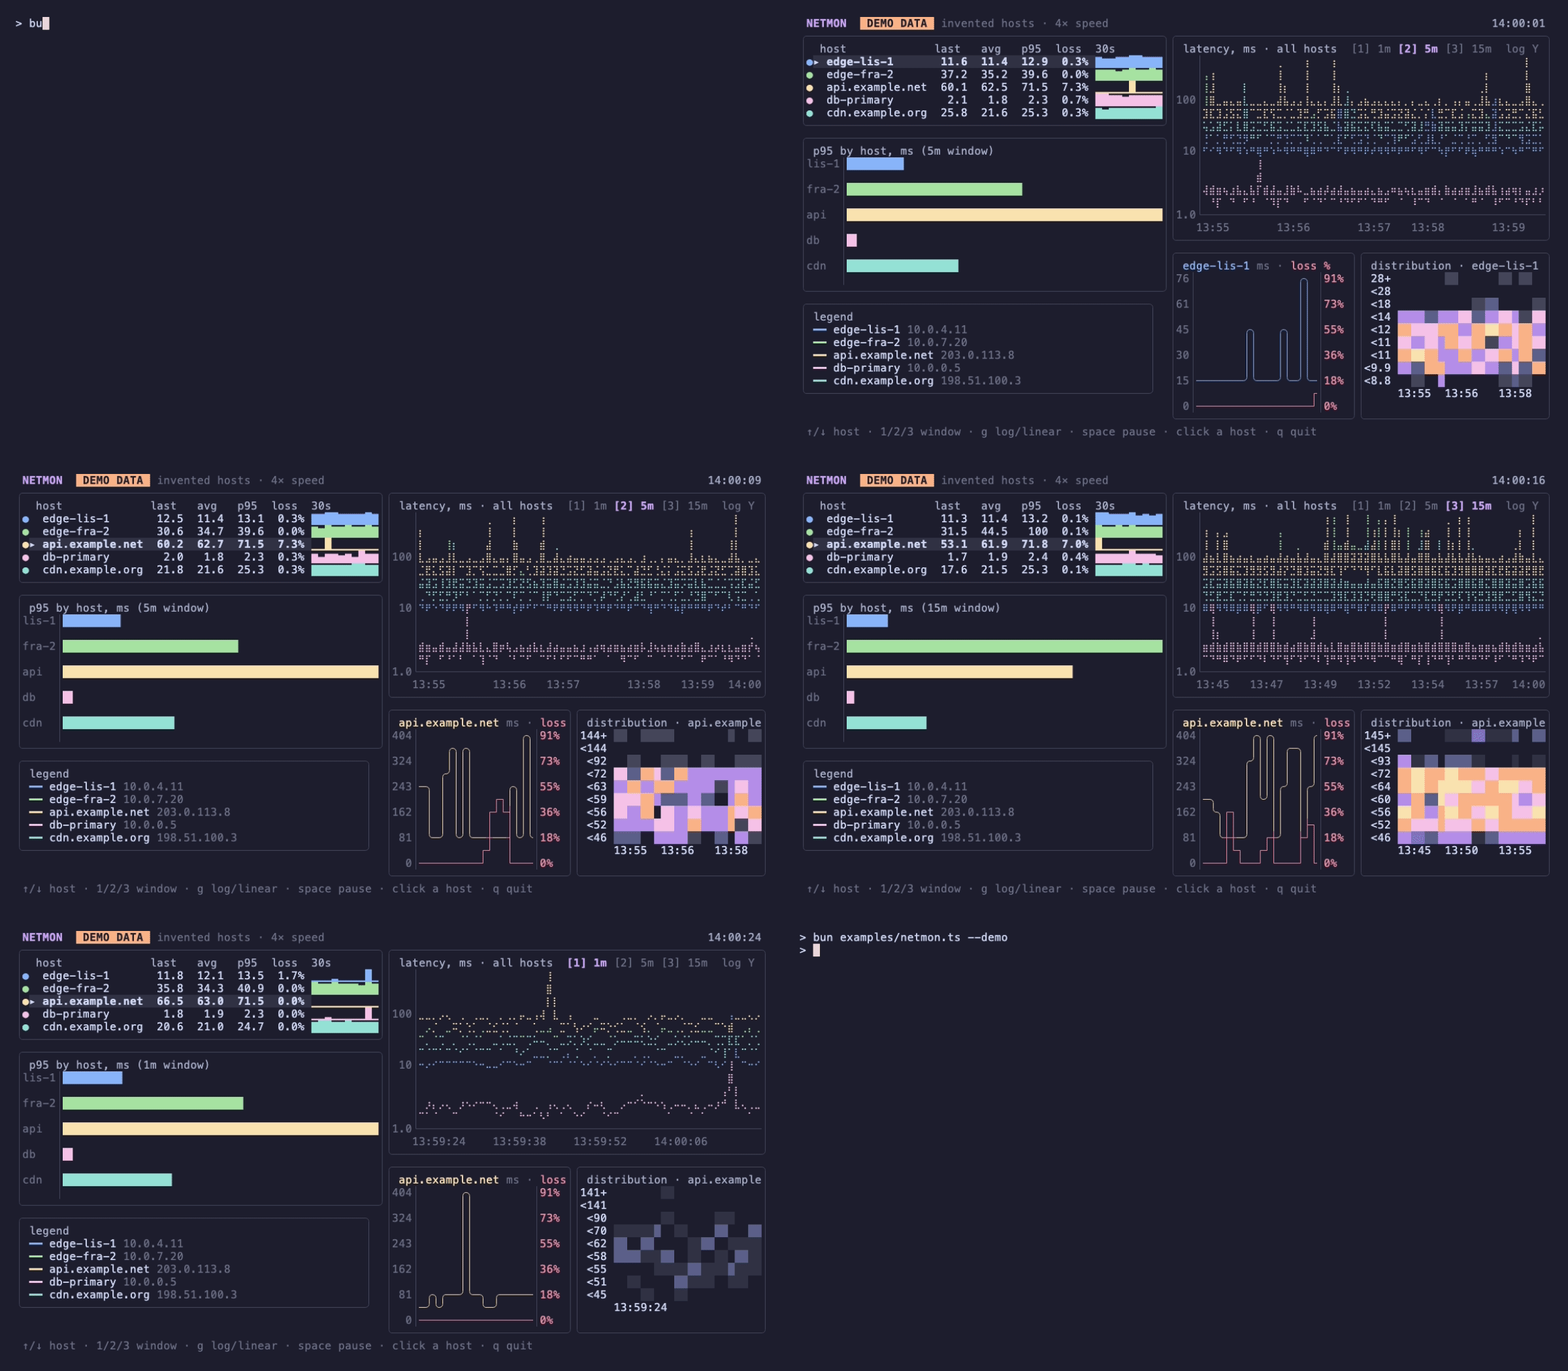
It puts every host on one braille chart with a log Y axis, because a 2 ms host and a 60 ms host would otherwise share the bottom row. The selected host gets a streaming chart with its loss on a second Y axis and a heatmap of its latency distribution over time. --demo replaces the network with invented hosts and a seeded random generator, which is what the recording shows.
Writing them turned up one problem outside the port. Ink, the React renderer for terminals, mishandles ESC[m, the short form of the reset sequence that Lip Gloss writes, when the text is inside a bordered <Box>: colors leak and widths go wrong. Replacing it with ESC[0m fixes it, and the README shows how.
VIII – What Was Left Out
Pictures. ntcharts can show images: picture draws them with half-block characters or sends them through the Kitty graphics protocol, heatpicture renders a continuous field as an image, pictureurl fetches one over HTTP, and chartpicture draws charts with the Go library go-analyze/charts. They need Go's image decoders (PNG, JPEG, GIF, WebP), which Node has no dependency-free equivalent of, and POSIX shared memory for fast Kitty transfers. The half-block renderer is also under the MPL-2.0 rather than MIT. A TypeScript version would be its own package that takes decoded pixels.
spec/echarts. It converts a spec to a go-echarts web chart. The spec itself is ported: the same JSON builds the same terminal chart in both languages, and the parity suite feeds the same JSON file to both.
cmd/ and web/. Upstream's command-line demos, terminal probes and WASM gallery. The examples cover the demos.
IX – Get It
npm install @oakoliver/ntcharts @oakoliver/lipgloss @oakoliver/bubbles @oakoliver/bubbletea
Source: github.com/oakoliver/ntcharts. Original library: NimbleMarkets/ntcharts by Neomantra Corp. Both MIT licensed.
To start using it, see Getting Started with ntcharts in TypeScript.
The TypeScript Charm Series
Each package is a TypeScript port of a Go tool from the Bubble Tea ecosystem, published on npm and running on Node.js and Bun.
| Package | What it does | Start here | How it was ported | Source |
|---|---|---|---|---|
| @oakoliver/lipgloss | Terminal styling | Getting started | Porting story | GitHub |
| @oakoliver/glamour | Markdown rendering | Getting started | Porting story | GitHub |
| @oakoliver/bubbletea | TUI framework | Getting started | Porting story | GitHub |
| @oakoliver/bubbles | TUI components | Getting started | Porting story | GitHub |
| @oakoliver/ntcharts | Terminal charts | Getting started | this article | GitHub |
| @oakoliver/huh | Terminal forms | Getting started | Porting story | GitHub |
| @oakoliver/glow | Markdown reader | Getting started | Porting story | GitHub |
| @oakoliver/gum | Shell script prompts | Getting started | — | GitHub |
| @oakoliver/vhs | Terminal GIFs | Getting started | — | GitHub |
– Antonio